


pprof 进行go的压测性能分析
一、代码
package testPprof

import "testing"

func Fb_recursion(num int) int {
    if num <= 2 {
        return 1
    }
    return Fb_recursion(num-1) + Fb_recursion(num-2)
}

func Fb_norecursion(num int) int {
    l := make([]int, num+1)
    for i := 1; i <= num; i++ {
        if i <= 2 {
            l[i] = 1
        } else {
            l[i] = l[i-1] + l[i-2]
        }
    }
    return l[num]
}

// go test -bench=Benchmark_Fb_resursion -cpu=1,2,4,8,16,32,1280 -benchmem  -cpuprofile cpuprofile.out -memprofile memprofile.out
// go tool pprof -http=":8081" cpuprofile.out 或 go tool pprof -http=":8081" memprofile.out
// -http="8081" 的图形化界面依赖于 Graphviz(http://www.graphviz.org/)
func Benchmark_Fb_resursion(b *testing.B) {
    for i := 0; i < b.N; i++ {
        Fb_recursion(20)
    }
}
二、进行压测
执行命令
go test -bench=Benchmark_Fb_resursion -cpu=1,2,4,8,16,32,1280 -benchmem -cpuprofile
之后得到cpuprofile.out和memprofile.out
三、使用pprof进行分析
CPU
go tool pprof cpuprofile.out
进入pprof的命令提示符,输入help获取命令列表,输入top打印CPU耗时排序。
(pprof) top
Showing nodes accounting for 9.96s, 96.23% of 10.35s total
Dropped 80 nodes (cum <= 0.05s)
Showing top 10 nodes out of 18
      flat  flat%   sum%        cum   cum%
     9.77s 94.40% 94.40%      9.81s 94.78%  mytest/testPprof.Fb_recursion
     0.08s  0.77% 95.17%      0.15s  1.45%  runtime.stealWork
     0.07s  0.68% 95.85%      0.07s  0.68%  runtime.scanobject
     0.01s 0.097% 95.94%      9.82s 94.88%  mytest/testPprof.Benchmark_Fb_resursion
     0.01s 0.097% 96.04%      0.06s  0.58%  runtime.mapassign_fast32
     0.01s 0.097% 96.14%      0.23s  2.22%  runtime.schedule
     0.01s 0.097% 96.23%      0.11s  1.06%  runtime/pprof.(*profMap).lookup
         0     0% 96.23%      0.17s  1.64%  runtime.findrunnable
         0     0% 96.23%      0.11s  1.06%  runtime.gcBgMarkWorker
         0     0% 96.23%      0.15s  1.45%  runtime.gcBgMarkWorker.func2
内存
go tool pprof memprofile.out
输入top 打印内存消耗排序
(pprof) top
Showing nodes accounting for 10392.51kB, 100% of 10392.51kB total
Showing top 10 nodes out of 41
      flat  flat%   sum%        cum   cum%
 5660.92kB 54.47% 54.47%  5660.92kB 54.47%  runtime.procresize
 1184.27kB 11.40% 65.87%  1184.27kB 11.40%  runtime/pprof.StartCPUProfile
 1024.23kB  9.86% 75.72%  1024.23kB  9.86%  runtime.malg
  902.59kB  8.68% 84.41%   902.59kB  8.68%  compress/flate.NewWriter
  596.16kB  5.74% 90.14%   596.16kB  5.74%  sync.(*Pool).pinSlow
  512.28kB  4.93% 95.07%   512.28kB  4.93%  runtime.allocm
  512.05kB  4.93%   100%   512.05kB  4.93%  runtime/pprof.allFrames
         0     0%   100%   902.59kB  8.68%  compress/gzip.(*Writer).Write
         0     0%   100%  1780.43kB 17.13%  main.main
         0     0%   100%   596.16kB  5.74%  regexp.(*Regexp).MatchString (inline)
四、增加图形界面支持
pprof增加图形界面支持需要安装Graphviz(http://www.graphviz.org/)。
http://www.graphviz.org/download/ 进入之后选择对应版本下载。
windows还需要将其添加到系统path环境变量中D:\soft\Graphviz\bin。
使用go tool pprof -http=":8081" cpuprofile.out 或 go tool pprof -http=":8081" memprofile.out 即可生成web图形界面。
该图很清晰的展示了调用流程和时间占比(框越大的时间占比越大)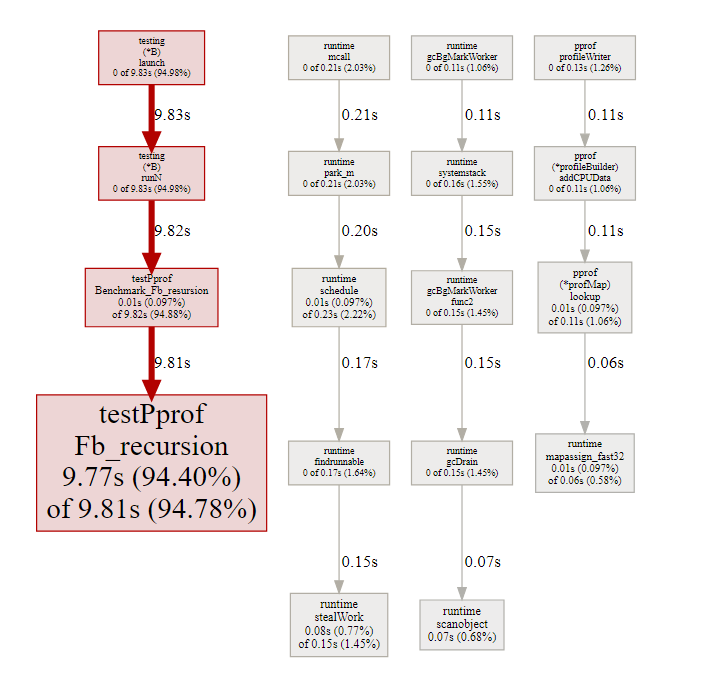
还可以在top中查看,占用排行。(点击对应列可以按该列进行排序)
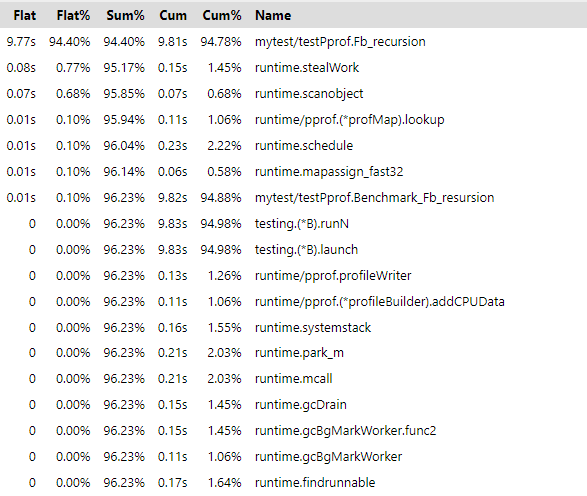
flat/flat%:分别表示在当前层级cpu的占用时间和百分比。
cum/cum%:分别表示截止到当前层级累积的cpu时间和占比。
sum%:所有层级的cpu时间累积占用。
版权声明
 本文章由作者“衡于墨”创作,转载请注明出处,未经允许禁止用于商业用途
发布时间:2022年05月07日 10:16:50
备案号: 闽ICP备19015193号-1
闽ICP备19015193号-1
关闭特效
评论区#
还没有评论哦,期待您的评论!
引用发言